Account Management
MyCFS
Creating a MyCFS account
How can I find my MyCFS login email/password?
Invalid login attempt
Reset your MyCFS password (when you don't know what it is)
Reset your MyCFS password (when you know your password but want to change it)
Why do I need a MyCFS account?
Purchasing
Adding an item to your shopping cart
Can I be invoiced or billed for my order? Can I pay by check?
Can I order prior year tax forms?
Do I need to renew every year?
How are shipping costs for forms, folders and envelopes calculated?
How can I update my credit card information with CFS?
How do I manage my payment, billing, or credit card info?
How do I pay by check?
How do I view my order history?
How long does it take to get custom folders?
Ordering Custom Folders
Purchasing Tax Forms, Folders, Envelopes and Checks
Purchasing tax forms and related envelopes
Removing an item from your shopping cart
Requesting sample tax supplies
Should I buy Payroll Suite?
Starter Kits Discontinued
Tax Supplies minimum quantity is 150 units (checks is 500)
What are Auto-renewals?
What shipping options are available to Alaska and Hawaii customers?
When am I supposed to renew?
When will I receive my order?
When will my order be shipped?
Where's my receipt?
Why can't I order forms and envelopes over the phone?
Why can't I send CFS a fax?
Why didn’t you tell me to renew my programs?
Why does CFS no longer send renewal packets?
Can I get a user’s manual for CFS programs?
Does CFS need to know my EIN?
How can I find the status of my order?
How do I contact CFS for technical support?
How to edit my firm information in my CFS program(s)
Quick Reference Guide is discontinued
Where can I get help for Fill-N-Print?
FAQ
Are CFS 1099 forms compatible with QuickBooks?
Are CFS W-2 forms compatible with QuickBooks?
CFS Licensing/End User License Agreement (EULA)
Can 1094 or 1095 ACA forms be e-filed?
Can CFS software be used with cloud storage services (OneDrive, DropBox, Google Drive, etc.)?
Can I download my program to another computer?
Can I efile 941s, W2s or 1099s?
Can I use your program on both my office and home computers? (Single User versus Network)
Can Payroll System split an individual employee's Direct Deposit transaction between more than one account?
Can employees see their pay stubs online?
Can prior year's continuous use forms be used even though the year field is different?
Do I need to first input a client before I can use the program?
Does CFS carry the form to set up Section 125 health plan for an employer?
Does CFS have a Written Information Security Plan?
Does CFS have a penalty and interest calculator?
Does CFS software support Beneficial Ownership Information Reporting?
Does CFS support Certified Payroll?
Does UPS require a signature upon delivery?
How can I find out what software is up for renewal and if I renewed?
How to switch browsers without changing the default
How will Payroll System handle OBBBA tips and overtime deductions?
Important Deadlines
Is CFS software compatible with Windows 11?
States supported by CFS Live Payroll and 941/940 Payroll System software
What are the advantages of downloading software instead of ordering CDs?
What is CFS' return policy?
What is the difference between the non-network and the network version?
What programs are compatible with Rightworks
What should I do when the items I ordered were damaged before I received them?
When are W-2s and 1099's (and 1098's) due?
When will the software be updated for a particular form?
Will LivePayroll custom payroll summary reports import from the prior year's program?
Internal
Program Instructions
General
Client Management
Clients
Adding or editing a client
Client Folder
Displaying additional client information in the Client List
Filter/Sort Client List
Finding Clients
How to enter a foreign address on a W2/1099?
Purge Deleted Clients
Set Client Codes
Data Migration
Backing Up Data to the Cloud
Backup Considerations
CSV Import Guidelines
Default Program Folder Locations
Export Client List
How do I backup my data?
How do I find missing backup data?
How do I move CFS programs and data to a new computer?
How do I move CFS programs and data to a new server?
How do I send client data to a colleague via email?
Importing client data between certain CFS programs
Importing clients from CSV file into TaxTools
Importing from non-consecutive program years
Lacerte Client List
Manually Importing Client Data From The Previous Year
ProSystem Client List
Restore Data from Backup
Setting Automatic Backups
Why is the program not automatically backing up?
Printing a list of clients
Configuration
Change printers from inside the program
Change printers in Windows 10
Change printers in Windows 7
Configuration Options
Hide/Display State Forms
How to Change Printers in Windows 11
Installation
Can I install CFS programs on a Mac?
Downloading the installer to a USB flash drive to transfer it to an offline computer
Entering Data at a Client's Office
Finding a downloaded file
How do I download and install an update from within the program?
How do I install a program or update in "safe mode?"
How do I manually download and install an update?
How do I map a network drive?
How do I perform a workstation setup?
How to download software from the CFS website
Install Procedure - Add private database
Install Procedure - Continue private database next year
Install Software in Demo Mode
Install Standalone Programs as a Single User
Install Standalone Programs to a Network
Install TaxTools Workshop as a Single User
Install TaxTools Workshop in Demo Mode
Install TaxTools Workshop to a Network
Installing to a terminal server
Manually Updating the Software
Reinstalling and repairing software
Uninstalling the Software
Why does my desktop shortcut open the installer?
Why does the setup tell me to reboot the computer?
Workstation setup locations
Licensing
Can I use my CFS program on both my office and home computers?
Do I need a network license?
How do I change my address or firm name?
How do I edit my license code/firm information?
How does my license code work?
How many computers am I licensed for?
Using a License Code to access a program
What is the purpose of a network license?
Where can I find my Customer ID number?
Where can I find my license code?
Where to Find the License Agreement Screen
Why does my license code change?
Why does the installer tell me my license code is invalid?
Main Screen
About Screen
Add, edit, or delete a network user
CFS Program Interface
Calendar and Notes
Getting Started
Label Setup Options
Label/Envelope Maker
Network Utilities
Preparer/Representative Database
Selecting multiple records
Utilities
Modules
Data File List
Federal/State Tax Planner
Field Details for Numeric Fields
Form 2848 - Power of Attorney
Formatting a field for SSN or EIN (How do I change from a Social Security Number to an EIN?)
How do I print to a PDF?
Module Interface
Module Library
Two ways to print from a module
Using the Editor
Release Notes
CA Sales Tax Preparer
Financial Planning Tools 2025 Update History
MD Personal Property
NY Sales Tax Preparer
Payroll System 2024 Update History
Payroll System 2025 Update History
Payroll System 2025 Update History
Small Business Tools
Small Business Tools 2025 Update History
TaxTools 2025 Update History
TaxTools WorkShop Update History
W4 Calculator Update History
Security
One Big Beautiful Bill Act
Payroll System
E-Filing
1099 E-Filing
States
1099 E-Filing Module Overview
1099 E-Filing Step 1: Inputting Transmitter Data
1099 E-Filing Step 2: Create IRS file (FIRE or IRIS)
1099 E-Filing Step 3: IRS Submittal
1099 E-Filing Step 4: Create state file
1099 E-Filing Step 5: State Submittal
1099 E-Filing: Checking file status
1099 E-Filing: IRIS CSV Portal Combined Fed/State filing
1099 E-Filing: Navigating IRIS CSV Portal Website
1099 E-Filing: Navigating the IRS FIRE System Website
1099 E-Filing: Submitting IRIS CSV Portal corrections
1099 E-Filing: Submitting corrections via FIRE
1099 E-Filing: submitting prior year files
Adding Responsible Officials to a TCC application
Applying for FIRE Transmitter Control Code (TCC)
Applying for IRIS Transmitter Control Code (TCC)
Are you sure you filed ALL your 1099's on IRS's tricky IRIS site?
Can the same TCC be used for both FIRE and IRIS?
Checking Size of Uploaded File
Correcting and re-uploading erroneous IRIS files
Creating an IRS FIRE account
Differences between E-Filing with FIRE and IRIS
Does CFS support the Combined Federal/State Filing program?
FIRE System Upload: Navigating to your File
Finding the exact Company Name for logging into IRS FIRE
Finding your FIRE TCC
Getting Started: W-2 and 1099 E-Filing
IRS lowers E-Filing threshold to 10 information returns of any type
If you find an error on the Review Form Information page on IRIS
Logging into FIRE with Internet Explorer 6
Logging into IRS FIRE with a Company Name that matches IRS records
Printing Summaries and Reports
Uploading 1099 files to CA SWIFT website
What to do when you receive your FIRE TCC
Modules
CA Form FTB 6274 - Waiver Request From Filing Information Returns Electronically
CA Form FTB 6274A - Extension Request to File Information Returns Electronically
Form 4419 - Application for Filing Information Returns Electronically
Form 8508 - Application for a Waiver from Electronic Filing of Information Returns
Payroll Return E-filing
Forms 941, etc.
941 E-Filing Module Overview
94x (941/940/943/944/945) E-Filing Step 1: Create Submission Files
94x (941/940/943/944/945) E-Filing Step 2: Create Transmission Files
94x (941/940/943/944/945) E-Filing Step 3: Upload File
94x (941/940/943/944/945) E-Filing Step 4: Check Ack File
94x E-Filing Common Problems 94x (941/940/943/944/945)
ETIN: Modifying Your IRS E-Services Application to E-file Forms 94x (Forms 941, 940, etc.)
Fixing rejected 941 files
IRS migrates e-Services login to ID.me
Opening the E-File Federal Employment Tax Returns module
Requirements to E-File Forms 94x (941/940/943/944/945)
Retrieving Your External IPv4 Address
Signature Methods
Submit a Communications Test File
When will Form 941 be released?
CA Bulk Payment Record
CA Form DE 9C - e-Services Import a CSV File
CA Forms DE 9 and DE 9C
IRS requires new data to be included in business payroll tax return e-files
NYS-45/NYS-1 - E-filing (Web Upload Files)
New York E-Filing Overview
Online State UI Filing Support
Online UI Filing Support from the State UI Form Module
PA UC-2/2A - UCMS FTP or File Upload Support
W-2 E-Filing
States
W2 E-Filing Module Overview
BSO How do I know if I need to (re-) request, “SSA’s Services Suite for Employers”?
BSO changes login procedure and users must re-authenticate
Creating a Business Services Online (BSO) Account
Fixing a mistake made after e-filing W-2s
Requesting access to the SSA Services Suite for Employers on BSO website
W-2 E-Filing Error: "Specific information that is required to file an information return is missing. All errors must be corrected before the file can be created" and "Incorrect or Missing Employer Signer Name"
W-2 E-Filing Step 1: Inputting Submitter Data
W-2 E-Filing Step 2: Creating an SSA File
W-2 E-Filing Step 3: SSA Submittal
W-2 E-Filing Step 4: Create State File
W-2 E-Filing Step 5: State Submittal
W-2 E-Filing: BSO New Requirement for Employer Information
W-2 E-Filing: Checking the Submission Status
W-2 E-Filing: Navigating the SSA's Business Services Online Website
"SSN cannot begin with a 6 or a 9" when e-filing
Accepted with Errors – How to Find (and fix) Information Form Errors (IRIS, 1099)
BSO and IRS FIRE System is down for maintenance dates
Can 1099s be filed with IRIS (Information Returns Intake System)?
Create a Cover Letter to send to clients after E-Filing
Creating Form 8809 Extension files
Do I have to E-File?
Do I need formal approval from my clients to E-File for them?
E-File Format Error W2 and 1099 file name .txt
E-Filing: Copying and pasting file name and path
E-filing additional forms that weren't included in first submittal
Federal e-filing status page
Find a client's E-Filing status with the Database Summary report
Finding the TCC online - Do I have a TCC (FIRE or IRIS)?
Handling omitted payees when 1099's or W-2's are added after transmission
How do I E-File Forms W-3 and 1096?
IRS requires existing TCC holders to complete the new IR application
Is the IRS website down?
Warning: Payroll System supports filing until the IRS and SSA BSO system year changeover in early December. After the system changeover, all files must be created with the current specifications used in Payroll System (for the current year)
What if I am too late to E-File?
FAQ
"The current license code does not allow access..."
Do I have to buy the Payroll Network license for every Payroll System program I have?
Do I have to buy the W2/1099 program even if I have LivePayroll?
Do I need to buy the W2/1099 program and W2/1099 E-File Add-on in order to electronically file W2/1099 returns?
Do W-2, W-3, 1099, or 1096 forms need to be printed on red forms or on plain paper in black ink?
Does CFS support WA Cares Fund for Long Term Care benefits?
Does Payroll System have password protection?
Finding a report of how many forms were prepared
Hourly rate is updated but Payroll System is still calculating at old rate
How Do I ... ?
How do I fix a duplicate reporting?
Printing SSA-approved, black scannable W-2 forms
Printing SSA-approved, black scannable W-3 forms
Prior Year Electronic Filing
The modules in W2/1099 are in red text instead of black text
What's New In Payroll System
When will Form 940 be released?
When will my program be released (or when will it be updated)?
Where is the 4th Quarter 941 module?
Where's my W2/1099 program?
Why can't I access the Payroll Corrector program?
Why can't I access the W2/1099 program?
Why don't you sell Payroll System as a package?
General (used in all 4 program parts)
Data Migration
Copy Employee/Recipient Info to Another Form
Copy Employee/Recipient to Another Client
Export Information Returns to CSV File
Export State Employee Wage Listing
Export client list to Excel
Import last year's 1095-B/1095-C As Is
Importing CSV files into Payroll System
Importing payroll or 1099 data from Excel
Importing prior year clients/payees/preparers/labels
Merge different employees into an employer
Move employee/recipient to another client
Payroll System QuickBooks Import
Restoring a deleted employee
Transfer Payroll Data to W-2
Transfer Vendor Payment Data to CA Form 592-B
Transfer Vendor Payment Data to Form 1099
Transfer W-2 data to W-2c from current or prior years
Database Maintenance
Payroll System Database Reconstruction
Repair Client Database
Special Database Recovery Detail Instructions
Special Database Recovery Overview
Modules
Affordable Care Act: Notice to Employee of Coverage Options
CA Form DE 1 - Commercial Employer Account Registration and Update Form
CA Form DE 1 HW - Employers of Household Workers Registration and Update Form
CA Form DE 1245W - E-File and E-Pay Mandate Waiver Request
CA Form DE 2251A - Affidavit of Mailing
CA Form DE 34 - Report of New Employee(s)
CA Form DE 4 - Employee's Withholding Allowance Certificate
CA Form DE 48 - Power of Attorney
CA Form DE 542 - Report of Independent Contractor(s)
CA Form DE 89 - Employer of Household Worker Election Notice
Cover Letter
Fax Transmission Cover Sheet
Finding 2nd Quarter Form 941 (2022 revision)
Florida Form RTS-3, Employer Account Change Form
Form 1094-B / 1095-B
Form 1094-C / 1095-C
Form 2848 - Power of Attorney and Declaration of Representative
Form 8809, Application for Extension of Time To File Information Returns
Form 8821, Tax Information Authorization
Form 8822-B - Change of Address - Business
Form 8952 - Application for Voluntary Classification Settlement Program (VCSP)
Form I-9, Employment Eligibility Verification
Form SS-4 - Application for Employer Identification Number
Form W-4 - Employee's Withholding Allowance Certificate
Form W-9 - Request for Taxpayer Identification Number and Certification
Invoice Generator
Memo
NY Form DTF-95 - Business Tax Account Update
NY Form DTF-96 - Report of Address Change for Business Tax Accounts
NY Form POA-1 - Power of Attorney
NY Form TR-2000 - E-ZRep Tax Information Access and Transaction Authorization Form
Paycheck Withholding Calculator
Statement of Account
To Do List
Withholding Tax Rate Tables
Program Operation and Utilities
About Screen
Active/Inactive Employees/Recipients
Adding employers and payers to the Client List
Calculation Methods
Client List Options
Client Status Fields
Create a copy of a client
Deleting an employee or a form
Displaying client details in the Client List
Employee/Recipient Options
End User License Agreement (EULA) Screen
Find Client
Find Employees/Recipients
Firm/License Information Screen
Import Prior Year W-2/1099 for E-filing Purposes
Network Utilities (Network Version Only)
Payroll Client Folder
Payroll Client List
Payroll Configuration Options
Payroll Firm/License Information Screen
Payroll Label/Envelope Maker
Payroll Module Interface
Payroll Module Library
Payroll System Overview
Payroll: Getting Started
Printing a Custom Report displaying active employees
Report Viewer Screen
Restore Deleted Clients
Selecting employees
Components of Payroll System
Payroll (ATF and Live)
LivePayroll
After-the-Fact Payroll is included in LivePayroll
Blank Check Setup
Can users submit tax liability payments through the direct deposit feature in CFS LivePayroll software?
Check Printing Supplies
Correcting 941 for missing ERC (Employee Retention Credit)
Creating a local rate schedule file
Direct Deposit Error code: 3
Direct Deposit in LivePayroll
Gross-up for All Taxes and Deductions
Illustrated examples of Direct Deposit scenarios
Live Payroll Setup utility
LivePayroll Overview
LivePayroll vs. After-the-Fact Payroll
NatPay Info
Paying 1099 recipients by Direct Deposit
Print Payroll Checks or stubs
Reprint, Modify or Delete a Check that has already been printed
Setting up a progressive or rate schedule tax
Setting up employee withholding
Setting up employers and employees in LivePayroll (Saving a new employee)
Setting up hourly employees
Setting up local withholding tax
Setting up vacation & sick leave
Typical Examples of Vacation/Sick Leave Policy Settings for Hourly and Salaried Employees
Vacation and Sick Leave in LivePayroll
Vacation/Sick Leave Employee Setup
Vacation/Sick Leave Overview
Vacation/Sick Leave Policy Setup
Vendor Check Utilities
Workers' Compensation Information
Workers' Compensation Report Setup
Workers' Compensation Setup
Modules
941-X - Simplest Procedure to add ERC (Employee Retention Credit)
Arizona AZFSET Web File for Withholding Return Filing
Arizona Form A1-APR - Annual Payment Withholding Tax Return
Arizona Form A1-QRT/A1-WP - Quarterly Withholding Tax Return
Arizona Form UC-018/020 Quarterly Unemployment Tax and Wage Report
Arizona Forms A1-R - Annual Withholding Reconciliation Return
CA EDD e-Services File Attachment
CA Form 592 - Resident and Nonresident Withholding Statement
CA Form 592-B - Resident and Nonresident Withholding Tax Statement
CA Form DE 3B HW - Employer of Household Worker(s) Quarterly Report of Wages and Withholdings
CA Form DE 3HW - Employer of Household Worker(s) Annual Payroll Tax Return
CA Form DE 88 - Payment Coupon
CA Form DE 9 - Quarterly Contribution Return and Report of Wages
CA Form DE 9C - Quarterly Contribution Return and Report of Wages (Continuation)
CO Form DR 1094 - Colorado W-2 Wage Withholding Tax Return
CO Form DR 1107 - 1099 Income Withholding Tax Return
CO Form UITR-1 - Your Quarterly Report of Wages Paid and Premiums Owed
CT Form CT-941 - Employer Quarterly Reconciliation of Withholding
CT Form CT-W3 – Connecticut Annual Reconciliation of Withholding
CT Form UC-2/5A/5B - Employer Contribution Return and Quarterly Earnings Report
CT UC-2/5A/5B - Bulk File Upload Support
FL Form RT-6 - Electronic Filing Instructions
FL Form RT-6 - Florida Quarterly Reemployment Compensation and Wage Report
FL Form RT-6 Electronic Filing Error Codes
Form 8453-EMP - E-file Declaration for Employment Tax Returns
Form 8655 - Reporting Agent Authorization
Form 8655 Reporting Agent List
Form 8879-EMP - E-file Authorization for Employment Tax Returns
Form 940 - Employer's Annual Federal Unemployment (FUTA) Tax Return
Form 941 - Employer's Quarterly Federal Tax Return
Form 943 - Employer's Annual Tax Return for Agricultural Employees
Form 944 - Employer's Annual Federal Tax Return
Form 945 - Annual Return of Withheld Federal Income Tax
Generic State Quarterly Unemployment Compensation and Wage Report
Georgia Form DOL-4N – Employer's Quarterly Tax and Wage Report
Georgia Form G-7 – Employer’s Quarterly Return For Monthly Payers and Voucher GA-V
Georgia Form G-7 – Employer’s Quarterly Return For Quarterly Payers
IL Form UI-3/40 - Employer's Contribution and Wage Report
IL Forms IL-941/IL-501 - Employer's Quarterly Withholding Income Tax Return
Instructions for Completing Employer Payroll Form WR-30
MD Forms DLLR/DUI 15/16 - Maryland Unemployment Insurance Quarterly Contribution and Employment Reports
MD MW506/MW506M - Employer's Return of Income Tax Report
MD MW508 - Annual Employer Withholding Reconciliation Return
MI Form 5080 - Sales, Use and Withholding Taxes Monthly/Quarterly Return (and Form 5095)
MI Form 5081 - Sales, Use and Withholding Taxes Annual Return
MI UIA 1028 - Employer's Quarterly Wage/Tax Report
Missouri Form MO-941 – Employer's Return of Income Taxes Withheld
Missouri Form MODES-4 – Quarterly Contribution and Wage Report
NC Web File Upload for Form NC-3
NJ-927 and WR-30 E-Filing Acknowledgement File
Nevada Form RPT3795/NEW0098 – Employer's Quarterly Contribution and Wage Report
New Jersey Form NJ-927/NJ-927-W and Form WR-30 E-Filing
New Jersey Form NJ-927/NJ-927-W/WR-30, Employer's Quarterly Report
New York Form MTA-305, Employer's Quarterly Metropolitan Commuter Transportation Mobility Tax Return
New York Form NYS-1, Return of Tax Withheld
New York Form NYS-45, Quarterly Combined Withholding, Wage Reporting and Unemployment Insurance Return
North Carolina Form NCUI-101 and NCUI-685, Employer's Quarterly Tax and Wage Report and Amended , Employer's Quarterly Tax and Wage Report
North Carolina Withholding Forms
Payroll Deposit Records
Pennsylvania Form UC-2 – Employer's Report for Unemployment Compensation
South Carolina Form WH-1601, Withholding Tax Coupon
South Carolina Form WH-1605, SC Withholding Quarterly Tax Return
South Carolina Form WH-1606, SC Withholding Fourth Quarter/Annual Reconciliation
TN Form LB-0456/0851, Quarterly Unemployment Premium and Wage Report
Texas Forms C-3/C-4, Employer's Quarterly Report
UT Form 33H - File Upload Instructions
UT Form TC-941-E - File Upload Instructions
Utah Form 33H/33HA, Utah Employer Quarterly Wage List and Contribution Report
Utah Form TC-941-E, Utah Withholding Return
Utah Form TC-941PC, Payment Coupon for Utah Withholding Tax
VA Web Upload for Return Filing
Virginia Forms VA-5, VA-6, VA-15, VA-16
Virginia Forms VEC-FC-20/21 – Employer's Quarterly Tax Report
Washington State Form F212-055-000 - Quarterly Report for Industrial Insurance
Washington State Forms 5208A and 5208B, Employer's Quarterly Tax and Wage Detail Reports
Wisconsin Form UCT-101 and UC-7823-E, Quarterly Contribution Report and Quarterly Wage Report
Program Operation and Utilities
Add FUTA Only Adjustment
Add State UI Adjustment
Add paycheck item for calculating NY SDI
Adding or editing vendors
Auto – Personal Use
Choose between entering Payroll Data by Date or by Payee
Cost of Employer Sponsored Health Coverage
Creating paychecks for a multi-state employee
Custom Payroll Journal
Customizing the Payroll Data Grid with the Options button
Deduction Items
Employee/Payee Reports
Entering a new client in Payroll
Entering hours by decimal or by number of minutes
Entering vendor payments
Garnishments
Gross-up for Employer Paid FICA
Gross-up for Employer Paid FICA and CA SDI
Health Insurance Compensation for 2% Owners of S-Corps
Health Savings Account (HSA)
Income Items
New Jersey Payroll Setup
Opening the Payroll Data Grid
Paycheck Utilities
Payroll Data Grid shortcuts
Payroll Diagnostics
Payroll Summary Reports
Reordering the columns on the Payroll Data Grid
S Corp Paid Medical Insurance
Setting up an employer with employees in multiple states
Setting up paycheck items
Show/Hide Payee Info in Payroll Data Grid
State Roth IRA
Tax Items
Qualified Overtime: Setting up income items
Transferring tips and overtime amounts to Box 14 Payroll System 2025
Treasury Tipped Occupation Codes (TTOC)
Payroll Corrector
Modules
CA Form DE 678 - Tax and Wage Adjustment
CA Form DE 9ADJ - Quarterly Contribution and Wage Adjustment Form
Form 941-X – Adjusted Employer's QUARTERLY Federal Tax Return or Claim for Refund
Form 943-X – Adjusted Employer's ANNUAL Federal Tax Return for Agricultural Employees or Claim for Refund
Form 944-X – Adjusted Employer's ANNUAL Federal Tax Return or Claim for Refund
Form 945-X – Adjusted Annual Return of Withheld Federal Income Tax or Claim for Refund
Form W-2c and W-3c
MI Form 5082, Sales, Use and Withholding Taxes Amended Annual Return
MI Form 5092, Sales, Use and Withholding Taxes Amended Monthly/Quarterly Return
New York Form NYS-45-X, Amended Quarterly Combined W/H, Wage Reporting and UI Return
W-2c Summary Reports
Can Form 941-X be E-Filed?
Do I need Payroll Corrector to correct e-filed returns?
Does Payroll Corrector correct prior year's forms?
W2/1099
Modules
AZ Form A1-T - Withholding Transmittal of Wage and Tax Statements
CFS Form Order Worksheet
CO Form DR 1093 - Annual Transmittal of State W-2 Forms
CO Form DR 1106 - Annual Transmittal of State 1099 Forms
CT Form CT-1096 – Connecticut Annual Summary and Transmittal of Information Returns
CT Form CT-W3 or CT-1096- CSV File Upload Instructions
DE WTH-REC - Annual Withholding Reconciliation Statement (for e-file only)
DE WTH-REC - CSV File Upload Instructions
Form 1096 - Annual Summary and Transmittal of US Information Returns
Form 1098 - Mortgage Interest Statement
Form 1098-T - Tuition Statement
Form 1099-A - Acquisition or Abandonment of Secured Property
Form 1099-B - Proceeds From Broker and Barter Exchange Transactions
Form 1099-C - Cancellation of Debt
Form 1099-DIV - Dividends and Distributions
Form 1099-INT - Interest Income
Form 1099-MISC - Miscellaneous Information
Form 1099-NEC - Nonemployee Compensation
Form 1099-PATR - Proceeds from Broker and Barter Exchange Transactions
Form 1099-R - Distributions From Pensions, etc.
Form 1099-S - Proceeds From Real Estate Transactions
Form 1099-SA - Distributions from an HSA, Archer MSA, or Medicare Advantage MSA
Form W-2 and W-3
Form W-2G - Certain Gambling Winnings
GA Form G-1003 - CSV File Upload Instructions
GA Form G-1003 – Income Statement Return
ID Form 967 -Idaho Annual Withholding Report
MO Form MO W-3 - Transmittal of Tax Statements
NJ Form NJ-W-3 - Reconciliation of Tax Withheld
North Carolina Form NC-3, Annual Withholding Reconciliation
OR Form OR-WR- Electronic Filing Instructions
Ohio IT 3, Transmittal of W-2 and 1099-R Statements
Oregon Form OR-WR – Annual Withholding Tax Reconciliation Report
PA Form REV-1667 - Annual Withholding Reconciliation Statement
PA Form REV-1667 - CSV File Upload Instructions
Qualified Overtime Calculator
Reporting Qualified Overtime 2025 W-2
South Carolina Form WH-1612 – Transmittal Form for W-2s or 1099s Submitted by Paper
West Virginia Form WV/IT-103 - Withholding Year End Reconciliation
What is the difference between 1099-MISC and 1099-NEC?
Program Operation and Utilities
Can forms be printed to separate PDF files for each recipient?
Create IRS Bulk TIN Matching File
Create SSN Verification Upload File
Formatting the Recipient field on Forms 1099: How do I change from separate first, MI and last name to a single entity name?
Mask an employee's SSN/TIN on printed payee statements
Printer Alignment
Printing Information Returns
Read IRS Bulk TIN Matching Results File
W-2/1099 Summary Reports
W2/1099: Transferring data between 1099-MISC form and 1099-NEC form
Golden parachute payments can no longer be filed through FIRE
Reconcile W-2s with 941
Which forms/envelopes are compatible with CFS W2/1099 Software?
How can I tell what states are supported by CFS Payroll System?
Specialized Programs
CA Sales Tax Preparer
Financial Planning Tools
College Savings Plans: 529 Plan vs. Alternatives
Form 709 - United States Gift (and Generation-Skipping Transfer) Tax Return
Forms Library
NY Sales Tax Preparer
CT Form OS-114 - Sales and Use Tax Return
Form FT-945/1045 - Sales Tax Prepayment on Motor Fuel/Diesel Motor Fuel Return
Form ST-120 - New York State and Local Sales and Use Tax - Resale Certificate
Form ST-120.1 - New York State and Local Sales and Use Tax - Contractor Exempt Purchase Certificate
Form ST-809 - New York State and Local Sales and Use Tax Return for Part-Quarterly (Monthly) Filers
NY Form FT-943 - Quarterly Inventory Report by Retail Service Stations and Fixed Base Operators
NY Form ST-100 - New York State and Local Quarterly Sales and Use Tax Return
NY Form ST-101 - New York State and Local Annual Sales and Use Tax Return
NY Form ST-810 - New York State and Local Quarterly Sales and Use Tax Return for Part-Quarterly (Monthly) Filers
Changes with Fill-N-Print
Fill-N-Print Discontinued
Quick Reference Guide
Tax Corresponder
W-4 Calculator
TaxTools
TaxTools WorkShop
Features
Browse or search through all Toolboxes
Client password protection
Customize how a Client's Files are listed
Downloading IRS PDF forms
Filtering clients based on the selected Toolbox
Free tools inside TaxTools WorkShop
Integrated knowledge base
PowerTools interface
Removing client password protection
Search for clients, client's files, and tools
Switching products using the Toolbox pulldown
Tagging clients
TaxTools WorkShop feature: Add your own PDFs to a Client's Files folder
TaxTools Workshop: Managing inactive clients
TaxTools Workshop: Setting automatic backups
Getting Started
All sales/property tax products can be found in the Sales and Property Tax toolbox
Carry files over to next year
Change screen font size
Check for TaxTools WorkShop updates
Connecting to an Existing Network Database
Copy Data Between Single User and Network
Creating a new network database
Deleting Clients
Firm Information Screen
How do I add email addresses or usernames for other users to grant them access to TaxTools WorkShop?
Importing clients from a CSV file
Importing clients from other CFS software into TaxTools WorkShop
Importing from Lacerte
Introduction to TaxTools WorkShop
Restoring from a .clad file
Rolling over client data
Running TaxTools WorkShop in the Windows Notification Area
Sorting and filtering by Client Code
Switching Between Single-User Mode and Network Mode
TaxTools Workshop: Importing from older programs
TaxTools Workshop: Peforming a Manual Backup
Using an email address to access a program
Licensing
Automatically extend subscriptions
Buying a subscription
Network upgrades and additional users
Partial-month subscription credit
Modules
Individual Tax Planner
CA Form 100, California Corporation Franchise or Income Tax Return
CA Form 100-ES, Corporation Estimated Tax
CA Form 100S, California S Corporation Franchise or Income Tax Return
CA Form 3519 - Payment for Automatic Extension for Individuals
CA Form 3520-BE, Business Entity or Group Nonresident Power of Attorney Declaration
CA Form 3520-PIT, Individual or Fiduciary Power of Attorney Declaration
CA Form 3520-RVK, Power of Attorney Declaration Revocation
CA Form 3522 - LLC Tax Voucher
CA Form 3525 - Substitute W-2, etc...
CA Form 3533 - Change of Address for Individuals
CA Form 3533-B - Change of Address for Businesses, Exempt Organizations, Estates and Trusts
CA Form 3534 - Tax Information Authorization
CA Form 3535 - Tax Information Authorization Revocation
CA Form 3536 - Estimated Fee for LLCs
CA Form 3537 - Payment for Automatic Extension for LLCs
CA Form 3538 - Payment for Automatic Extension for LPs, LLPs, and REMICs
CA Form 3539 - Payment for Automatic Extension for Corporations and Exempt Organizations
CA Form 3563 - Payment for Automatic Extension for Fiduciaries
CA Form 3567 - Installment Agreement Request
CA Form 3840 - California Like-Kind Exchanges
CA Form 4905 BE, Offer in Compromise Application – BE
CA Form 540-ES, Estimated Tax For Individuals
CA Form 541-ES, Estimated Tax For Fiduciaries
CA Form 565, Partnership Return of Income
CA Form 568, Limited Liability Company Return of Income
CA Form 593 - Real Estate Withholding Statement
CA Form 8454 - e-file Opt-Out Record for Individuals
CA Form DE 999A, Offer in Compromise Application
Form 656, Offer in Compromise
Inherited IRA - Required Minimum Distribution (RMD)
Troubleshooting
"Initial Validation Failed"
"Invalid user settings"
"Offline mode has expired"
"The program failed to initialize. Please re install the program."
"The program is already running"
Error: "An internet connection was not found"
Error: "The program cannot connect to the CFS server"
Finding or changing the Network Data Path
Import prior year 571s created in TaxTools WorkShop
Licensed software is stuck in demo mode
Mapped drives aren't visible
Recover Missing Clients
Remove All Client Locks
Repair Classic Client Database
Sending diagnostic logs to tech support
TaxTools WorkShop freezes on startup
Troubleshooting internet connectivity
User Account Control (UAC) message: "Do you want to allow this app to make changes to your device?"
View and send error logs
Adding a custom logo to worksheets
Silently install TaxTools WorkShop
Troubleshooting
Errors
"A transmitter TCC must be used to submit for more than one business"
"Cannot find associated company information" on IRS FIRE
"Download failed" error
"Error 9 Subscript Out Of Range" when trying to 'Add/Edit Payroll Data'
"Exceeded maximum amount" with respect to Social Security and CA SDI withholdings
"Information provided is not correct" when logging into FIRE
"Not saved" message
"OCX File Missing" or "OCX File Not Registered" error after updating Windows
"Registration file not found at the network"
"Small Fonts and Sans Serif can't be found" when Starting Program
"The app you're trying to install isn't a Microsoft-verified app"
"The file, BACKUP.STP, which is required on removable media backups, is not present."
"The uploaded file contains one or more errors"
"This app can't run on your PC"
"This client is currently locked by another user. Access is denied."
"User ID or Password Invalid" when attempting to log into IRS FIRE system
"[Program] is locked" when attempting to update
After installation the desktop shortcut icon is wrong or missing
Automatic Backup No Longer Works
CFS Setup runs another vendor's installer
CFSSTRT: Program <File Name> was not Found in Folder <Folder Name> - Install may be Necessary
Checks are printing in regular font instead of MICR font used by banks
Class not Registered
Component not Registered
Data Directory Invalid error
Error 0 or Error "MagMedSub.mdb is missing from the appath inis folder"
Error 1004: Error Accessing Database
Error 105: The transmission was unsuccessful
Error 12007 "Name not resolved" on Update from the Web
Error 12029 "Cannot Connect" on Update from the Web
Error 12031 when Downloading
Error 13: Type Mismatch
Error 16 when Printing Form
Error 1706: No valid source could be found for product ( ). The Windows Installer cannot continue.
Error 2018: Page margins are too large, can't run report
Error 2019 when Printing Report
Error 3021 No Current Record
Error 3022 in Payroll System
Error 3031 when Restoring Payroll Data
Error 3045 in Payroll System
Error 3049 in Payroll System
Error 3050 "unable to lock" in Payroll System
Error 3051: The Microsoft Jet database engine cannot open the file...
Error 3075 in Payroll System
Error 3078: The Microsoft Jet database engine cannot find...
Error 3112 in Payroll System
Error 3265: "Item not found in this collection"
Error 32765 when printing
Error 3343 in Payroll System
Error 3421 when Restoring Data
Error 35761 when Attempting to Update
Error 35764 when Attempting to Update
Error 3633 when Starting Payroll System
Error 3800 in Payroll System
Error 380: Invalid property value
Error 381: Invalid property array index
Error 400: Form already displayed; can't show modally
Error 429 when Printing Form
Error 429: ActiveX component cannot create object
Error 429: You don't have an appropriate license to use this functionality
Error 480: Can't create AutoRedraw image
Error 481: Invalid Picture
Error 482 when Trying to Print
Error 484 when Trying to Print
Error 48: Trouble loading DLL
Error 5001 on Installation
Error 5003 during Print Preview
Error 52: Bad file name or number
Error 53: File Not Found
Error 5: Invalid procedure call
Error 62: "Input past End of File"
Error 63 and Error 380
Error 6: Overflow
Error 7 when Starting Program
Error 70: Permission Denied
Error 75: Path/File Access Error
Error 76: Path not Found
Error 9 and Error 381
Error 9 and Error 63
Error 91: Object variable or With block variable not set
Error 94 - Invalid Use Of Null: When Trying To Add/Edit Payroll Data
Error Message: "A previous version of [program] was not found..."
Error Message: "Not a Valid Win32 Executable"
Error Message: "Version of the application could not be determined"
Error Message: "Zip file damaged"
Error TX4OLE invalid property value 1-900
Error Using Font - There was an error using the font OCR-ACFS [Payroll System Only]
Error: "Installed Version Could Not Be Determined"
Form is missing text and/or graphics (boxes, shading and lines)
Forms are Printing in Landscape
Forms print on both sides of the paper
Install / Uninstall: Setup Runs Another Vendor's Installer
Installer's Repair option freezes on EXE files
Installing fonts manually
MICR Font Not Installed - The MICR font necessary to print on blank check stock is not installed
Mapped network drives are not visible during installation
Message that something "needs to be installed" or "is on CD"
Modules do not load and no error is displayed
Modules in TaxTools Workshop Won't Open
Move Data Process Errors
OCR-A (or OCR-ACFS) font is not properly installed
Only Client Demographic Data is Imported, No Client Folder Data is Imported (When Importing Data from the Prior Year)
Printing paychecks freezes Payroll System
Printouts are crunched into a small area at the top of the paper
Program Crashes Without Error Message when Printing
Program doesn't open - no error message
Program freezes after displaying Error 52: "Bad file name or number"
QBXML Query Response Error
Runtime Error '5' Invalid procedure or argument
Setup Stalls During Full Install
Still Running Old Version after Update
TaxTools Workshop: Toolbox not updating
The item '...ST.exe' that this shortcut refers to has been changed or moved
The top of the window is off screen
Two Clients Share a Directory
Update Setup Reports File Is Locked
Update Setup Stalls
When printing red forms all pages are blank
Your Network Data Is Read-Only
A client's file is not on the list of those that can be E-Filed
Can't scroll down to see all clients on the Step 2 tab of e-filing
Forms are printing with lines through the text
IRS website is unresponsive
Overlapping layers of text when printing
Running CFS software on Arm-based PCs
Table of Contents
- All Categories:
- Program Instructions
- General
- Modules
- Federal/State Tax Planner
Federal/State Tax Planner
The Federal/State Tax Planner is included in TaxTools, Small Business Tools, and Financial Planning Tools. It allows the user to calculate federal and state income taxes for up to five years or five scenarios.
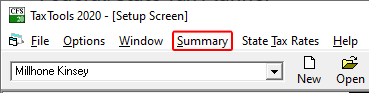
Opening the Tax Planner
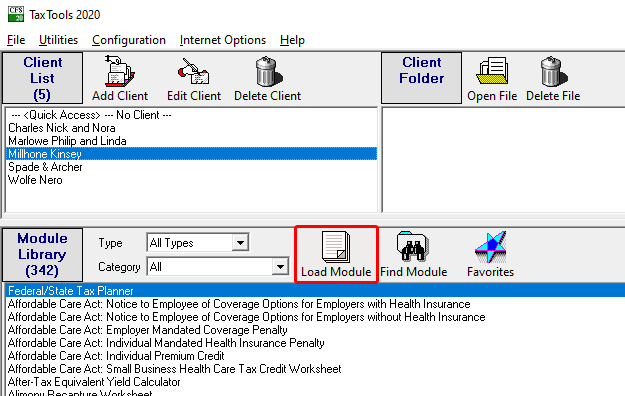
To open the Tax Planner, first select a client in the Client List, then either double-click on Federal/State Tax Planner in the Module Library, or select it and click the Load Module button:
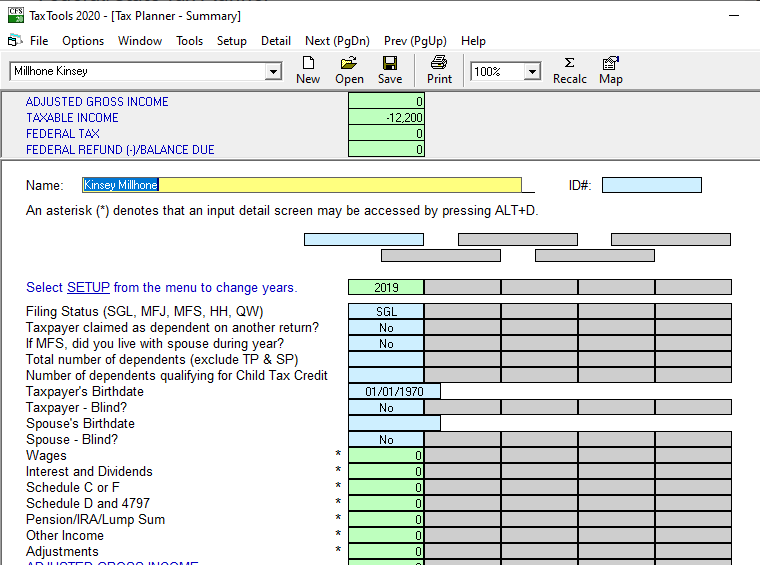
The Tax Planner will open with client data from the selected client mapped in:
Setting Up the Tax Planner
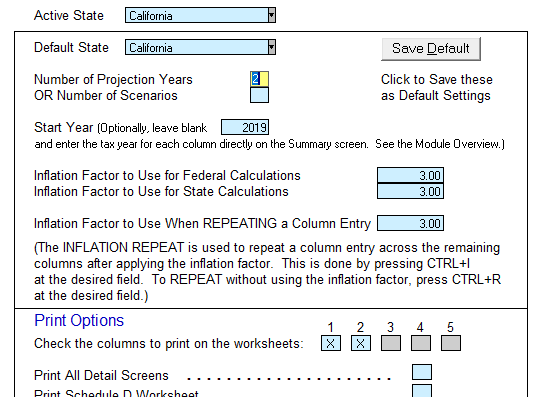
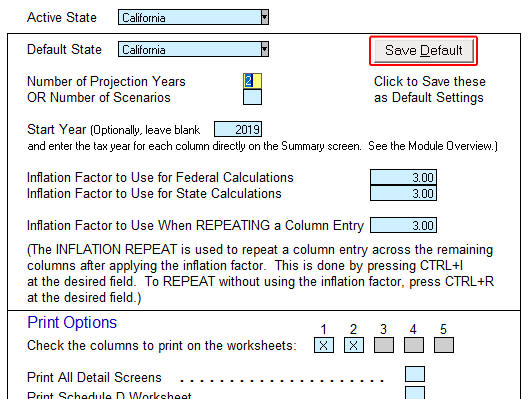
Setup Screen
This Setup Screen is where you set up the the following parameters:
- Active State (state for current calculations),
- Default State,
- Number of Projection Years (or Scenarios),
- Start Year,
- Inflation Factors, and
- Print Options.
To access the Setup Screen, click Setup on the toolbar:
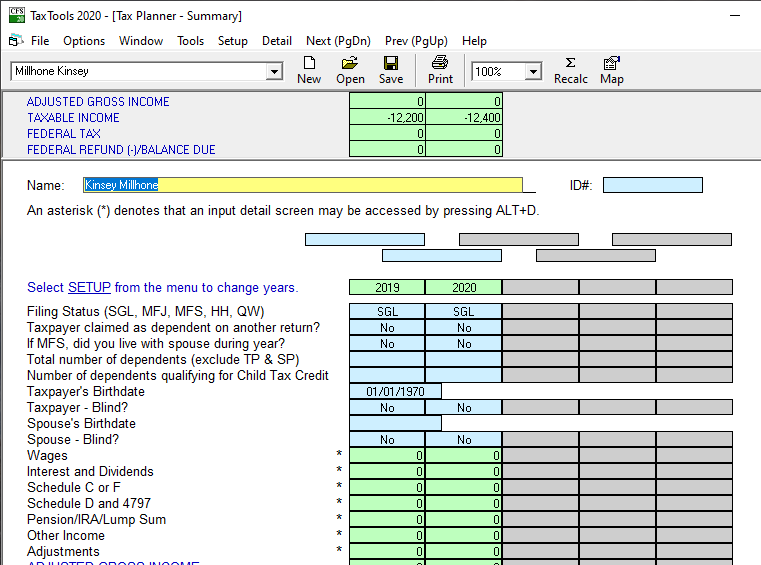
In the below illustration, the Tax Planner has been set up for a two-year projection, beginning with 2019:
When you've finished with the Setup screen, click Summary to return to the Summary screen:
Here's the resulting Summary screen:
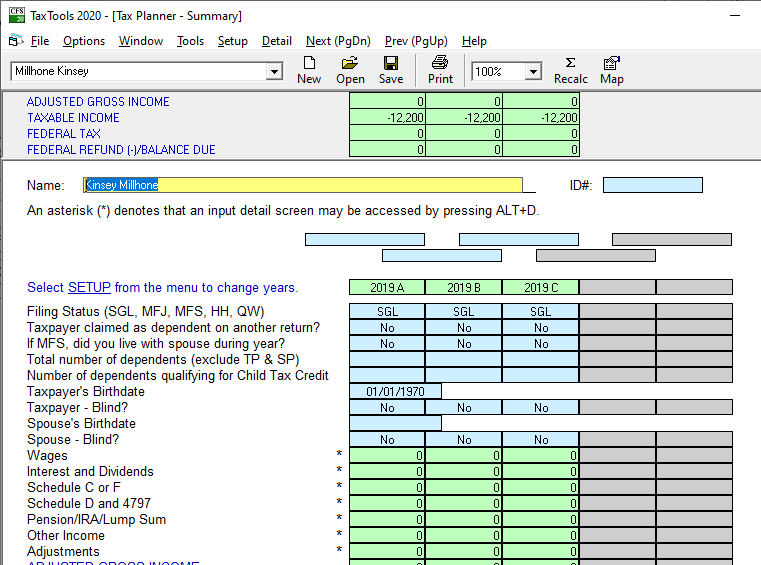
Here's the Summary screen for a three-scenario setup:
If you click the Save Default button after changing the settings in the Setup screen, the settings will be used for subsequent tax plans. Otherwise, the settings will apply to only this plan.
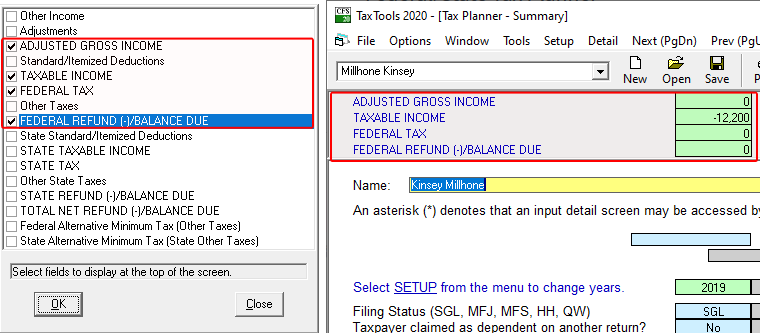
Top-of-Page Fields
Fields can optionally be displayed at the top of each page, allowing you to view some calculation results without having to return to the Summary screen. This feature is controlled by options on the Tools menu:
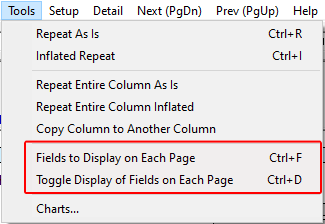
- Fields to Display on Each Page displays a menu of fields which can be selected for display when the feature is turned on. (The menu can also be accessed by pressing Ctrl+F.)
- Toggle Display of Fields on Each Page allows you to turn the feature on and off. (This can also be done by pressing Ctrl+D.)
In the illustration below, the ADJUSTED GROSS INCOME, TAXABLE INCOME, FEDERAL TAX, and FEDERAL REFUND (-)/BALANCE DUE fields have been selected from the menu (left), and are therefore displayed at the top of each page (right):
Screens and Data Entry
Summary Screen
The Summary Screen is the first thing you see when you open the Tax Planner:
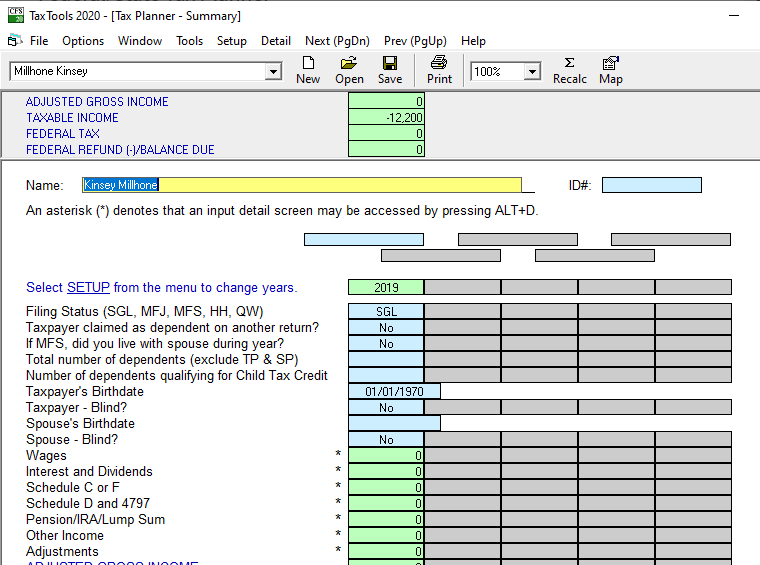
Some data is entered on this screen, but most will be entered on Detail screens, which will be discussed next.
Note the blue, green, yellow, and gray fields:
- Blue fields are for user data input;
- Green fields display calculation results;
- The yellow field is the active field (the one your cursor is currently in);
- Gray fields are not accessible.
Access help by pressing the F1 key:
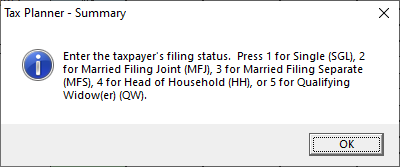
Access help for a specific field by pressing F2 when your cursor is in the field. For example, here's the help for the Filing Status field:
Field help can also optionally be displayed in a yellow Help Panel at the bottom of the screen:

Detail Screens
In addition to the Summary Screen, there are seven Detail Screens where data is entered for calculated fields. To access the detail screen for a field, either double-click on the field or press Alt-D when the field is active. You can also cycle through the detail screens by using the PgUp and PgDn keys.
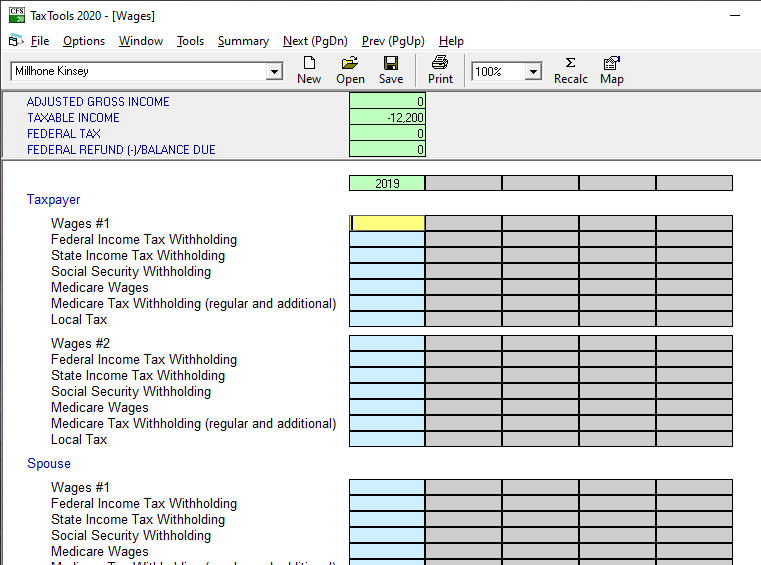
For example, double-clicking in the Wages field on the Summary Screen takes you to the Wages detail screen:
From there, pressing the PgDn key will take you to the Income - 1 detail screen...
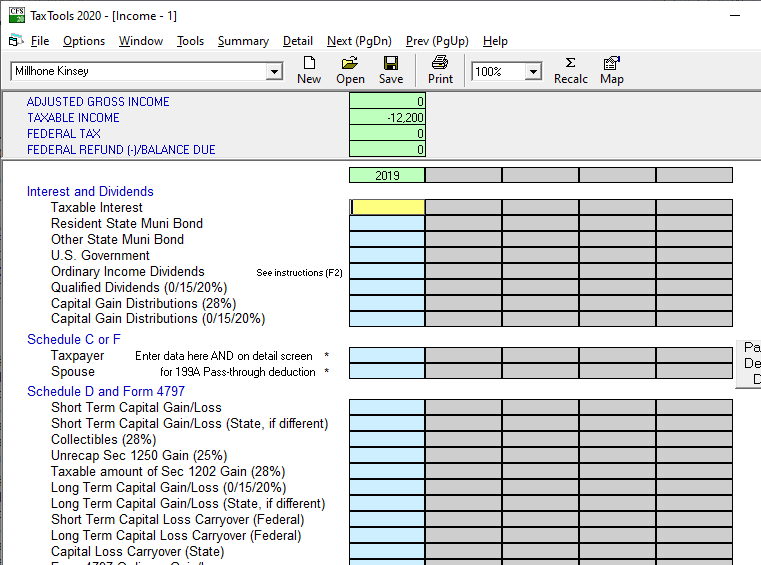
...and so on.
Some Detail Screens have additional Detail Screens within them. For example, several fields on the Other Income (Income - 2) detail screen are marked with an asterisk, indicting that they have their own detail screens:
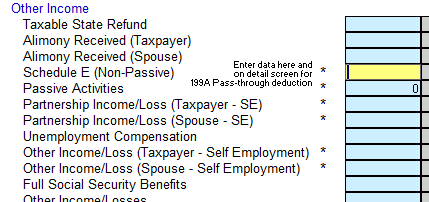
Double-clicking in one of these fields opens its detail screen, such as this one for the 199A Pass-through Deduction:
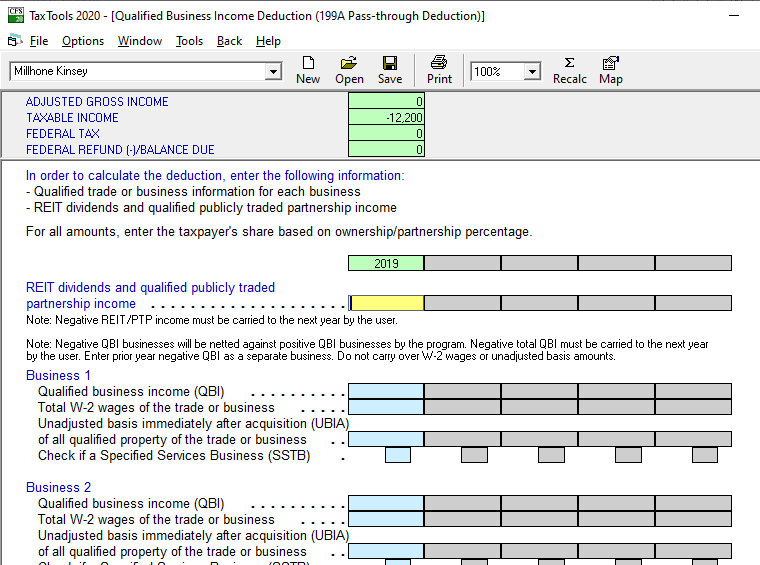
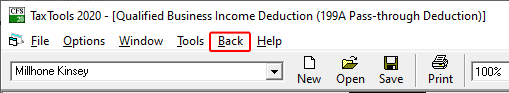
To return to the Income - 2 screen, click the Back button on the toolbar:
Copying from Column to Column
If you are using multiple columns, there a several options available from the Tools menu that will allow you to copy data from column to column:
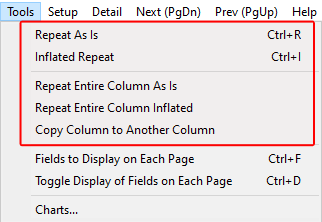
- Repeat As Is copies the amount in the current field (field the cursor is in) into all columns to the right. (This can also be done by pressing CTRL+R.)
- Inflated Repeat inflates and copies the amount in the current field into all columns to the right, using the inflation factor entered on the Setup screen. (This can also be done by pressing CTRL+I.)
- Repeat Entire Column As Is copies all amounts in the current column (column the cursor is in) into all columns to the right.
- Repeat Entire Column Inflated inflates and copies all amounts in the current column to all columns to the right, using inflation factors entered on the Setup screen
- Copy Column to Another Column copies the current column to any other column.
Charts
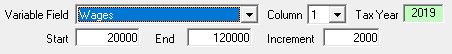
The Charts feature, accessed from the Tools menu, allows you to plot various tax results against variable income fields. You can also use it to compare taxes in different states. Click Charts... on the Tools menu to view the Chart Options screen:
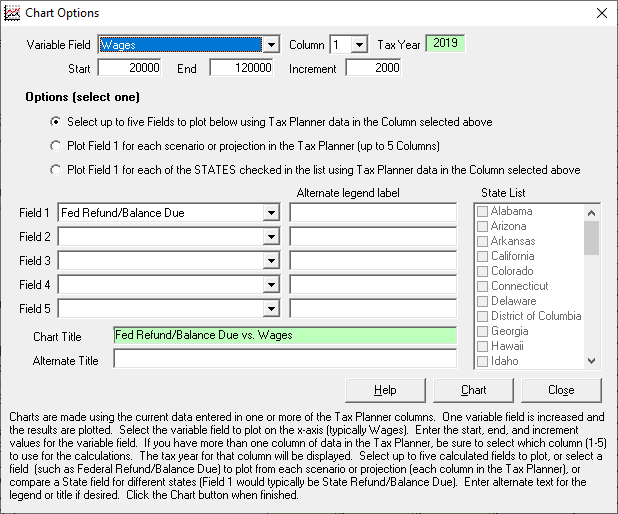
Variable Field
First, choose a Variable Field from the dropdown menu, and Start, End, and Increment values to determine the scale for the Variable Field:
Options
Next, choose one of the three options available:
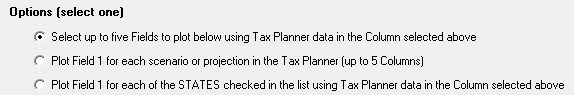
Select up to five Fields to plot using Tax Planner data in the Column selected
This option allows you to plot five different result fields as the Variable Field changes. Select the desired fields from the dropdown lists next to the labels Field 1, Field 2, etc. If the Tax Planner is currently displaying more than one column (projections or scenarios), you must specify the column to plot using the column selector at the top of the screen.
Plot Field 1 for each scenario or projection in the Tax Planner
If the Tax Planner is currently displaying more than one column, this option will increment the variable field in each column and plot it against the result field specified next to Field 1. This can be used to plot the tax for up to 5 scenarios as the Wages increase, for example.
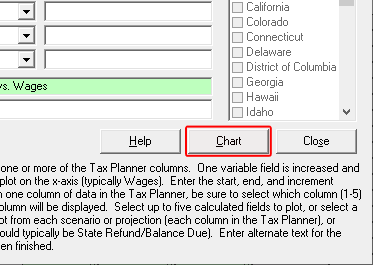
Plot Field 1 for each of the STATES selected in the List
This option allows you to compare the state tax for different states as Wages increase. Check the desired states to compare from the list and select the result field next to Field 1. This should be a state field, typically State Refund/Balance Due, since you are comparing state results. If the Tax Planner is currently displaying more than one column (projections or scenarios), , you must specify the column to plot using the column selector at the top of the screen.
Alternate Legend / Title
By default, the program uses the Variable Field name and the Result Field name to create a default title and legend label for the chart. However, you can enter your own text to use as the title and legend labels, if desired.
Viewing / Printing Chart
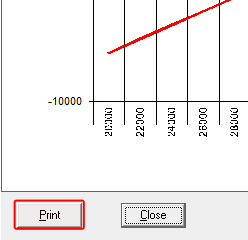
After setting the parameters, click the Chart button to view the resulting chart:
To print the resulting chart, click the Print button in the lower left corner of the chart:
Print Options
A number of print options are available from the File menu:
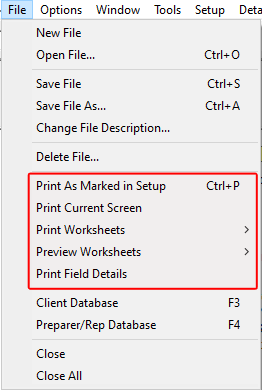
- Print As Marked in Setup prints according to the options you chose on the Setup Screen.
- Print Current Screen prints only the current screen.
- Print Worksheets allows you to select worksheets to be printed from a sub-menu.
- Preview Worksheets allows you to preview worksheets onscreen before printing.
- Print Field Details allows you to print detail screens.
This concludes the tutorial. For more information, please see the module Help file.